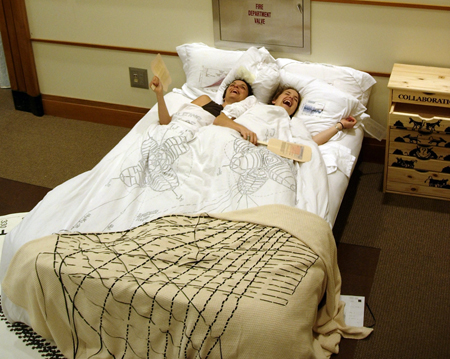
Hot Bed
punning on climate change
Hot Bed
2007
Installation: Bissel Gallery
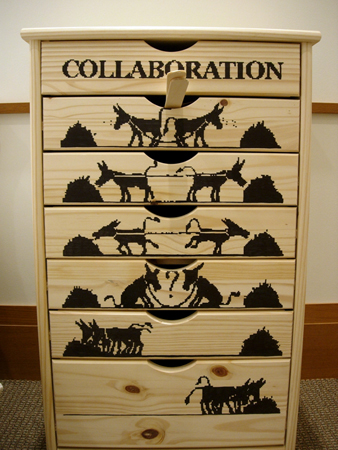
Collaboration bedside table
Graph submitted by Joe M Regenstein
"A wonderful illustration of what collaboration can accomplish"
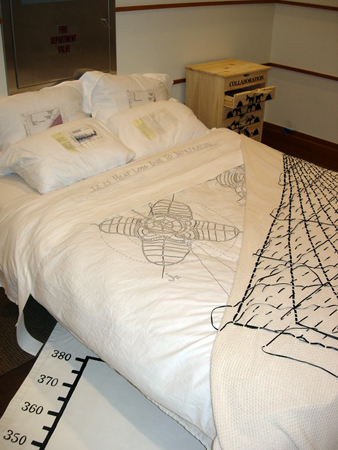
Psychometric throw
Graph submitted by Mike Timmons
"Jen, 2 charts from me:
1) Psychometric Chart
2) Moody Diagram"
(A psychometric chart is presented here on the beige cotton throw. From wiki, The term derives from the Greek psuchron (ψυχρόν) meaning "cold"[1] and metron (μέτρον) meaning "means of measurement". The most common system of interest is the mixture of water vapor and air, because of its application in heating, ventilating, and air-conditioning and meteorology. In human terms, our comfort is in large part a consequence of, not just the temperature of the surrounding air, but (because we cool ourselves via perspiration) the extent to which that air is saturated with water vapor.)
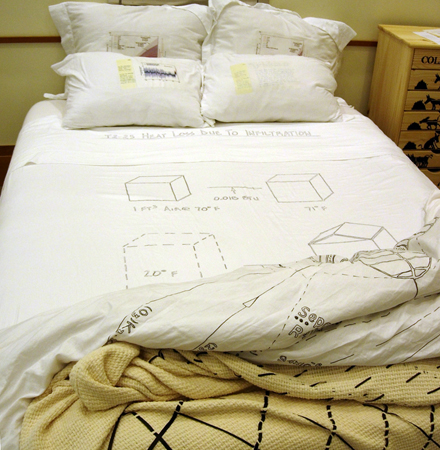
Heat Loss Due to Infiltration cotton sheet
Graph submitted by Joe Laquatra
"I saw these images as a new faculty member in 1984. They depict how much heated air leaves a house every hour during the winter and are accompanied by a calculation that quantifies the BTUs in that volume of air. We have in the U.S. what has been described as an efficient system for producing inefficient housing. These images motivated me to embark on an outreach program for educating home builders, home buyers, landlords and tenants about residential energy efficiency. Twenty-two years later I am still working on that mission."
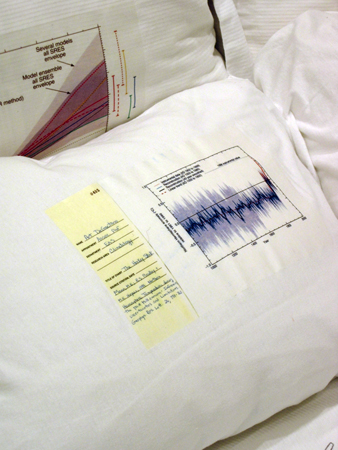
CO2 pillow case (detail)
This and other pillow graphs submitted by
Art DeGaetano
and Tim Fahey
Referred to as the 'hockey stick' graph, this diagram depicts northern hemisphere temperture over the last 1000 years.
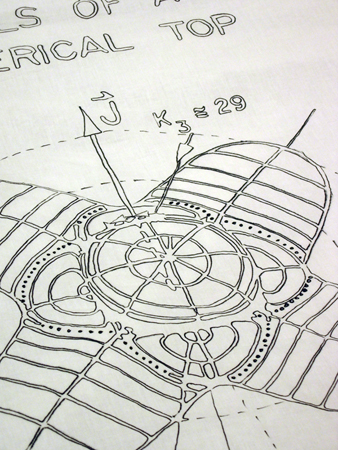
SF6 down duvet (detail)
Graph submitted by Greg Ezra
"In this beautiful figure Harter and Patterson convey and astonishing amount of information concering the dynamics of rapidly rotating spherical top molecules, i this case the octahedral species SF6 (sulfur hexafluoride). The novel 'rotational energy surface' construction explains at a glance the classical rotation-vibration motion in the molecule-fixed frame, the semiclassical quantization of trajectories leading to the observed quantum levels, and the level structure itself, in particular the hitherto puzzling clustering of levels into sets of 6-fold and 8-fold degenerate levels."
Bissel Gallery, Ithaca, NY
This piece employs a variety of material puns.
When I give talks on greenhouse gas emissions to farmers, I have to discuss the Global Warming Potential (GWP) of various greenhouse gases. That is, different molecules have different potency in effecting climate change. One day, I used a metaphor of a cotton sheet, a wool blanket, and a down comfortor to explain these various GWPs. While not exactly analogous to what is presented here, it was the inspiration for this domestic corner.
The thin cotton sheet depicts an equation for calculating heat loss in leaky houses. The down comfortor duvet depicts SF6, a greenhouse gas that is >25,000 times as potent as CO2 -it's hot! A weave in a cotton throw depicts a psychometric chart engineers use to manage water vapor and temperature for heating and cooling. Trends in CO2 emission pillows present a case to rest your head on at night. A graph of CO2 emissions as bedsite rug. A bedside table depicting collaboration. Inside the collaboration drawer, a set of political style hand fans depicting more graphs on climate, so you and your partner can cool each other off (unfortunately, it won't mitigate the methane emissions).