Tea Corner
clustering of random facts
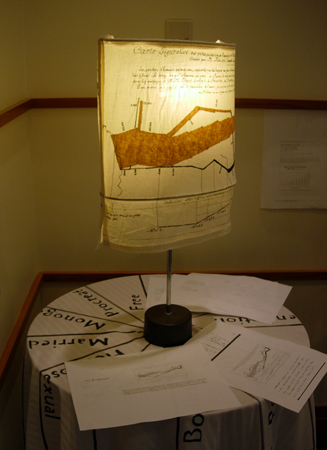
Napoleans March lampshade
Graph submitted by Lou Albright
Polley McClure
& P I Kuniholm
2007
Installation: Bissel Gallery
Photo by Nancy Wightman, Lamp gifted to Janet McCue.
Resume
Highlights:
Visualizing Meaning Documentary
Visualizing Meaning Website
Return to Copying the Masters Installation
Return to AudibleWink home page
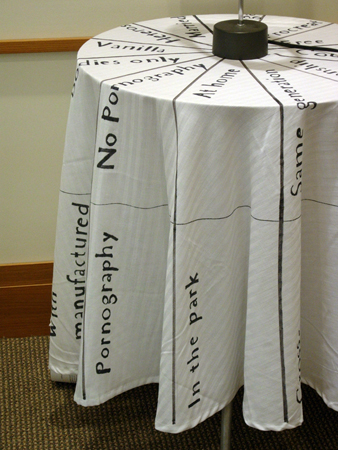
Tea Table tablecloth
Graph submitted by Ellis Hanson
2007
Installation: Bissel Gallery
Tablecloth gifted to Mindi Schneider
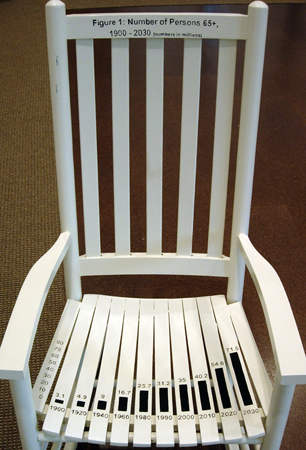
Aging US rocker
Graph submitted by Karl Pillemer
2007
Installation: Bissel Gallery
(rocker was made in the USA)
"This simple chart (from the U.S. Administration on Aging) shows...the unprecedented aging of the population. From 3 million people 65 and over in the lst century, the U.S. elderly population will exceed 70 million in~25 years. The staggering implications for health and human service systems, family life and other institutions are only now starting to be recognized."
Bissel Gallery, Ithaca, NY
2007
3 graphs were cornered together:
1) Napoleons march on Russia (The number of troups Napoleon left France with is depicted in brown, the number he returned with is in black. Most human loss was due to bad planning for weather and food).
2) A chart of sexual orientation on a tea table cloth;
3) A bar chart of aging stats of eldery in the US (on a rocker).